In the previous post, I gave you a fast glance to catch the differences between MATLAB style and OO style. In this post, you can learn basics of OO style codes.
The main references are come from the official matplotlib website, “matplotlib.org” and the book, 『Python Data Science Handbook: Essential Tools for Working with Data, Jake VanderPlas, O’REILLY, 2017』.
3. Basics of Object Oriented APIs
a. Basic objects
ⅰ. Anatomy of plot
The below famous figure called ‘Anatomy of a figure’, comes from official matplotlib site [Link]
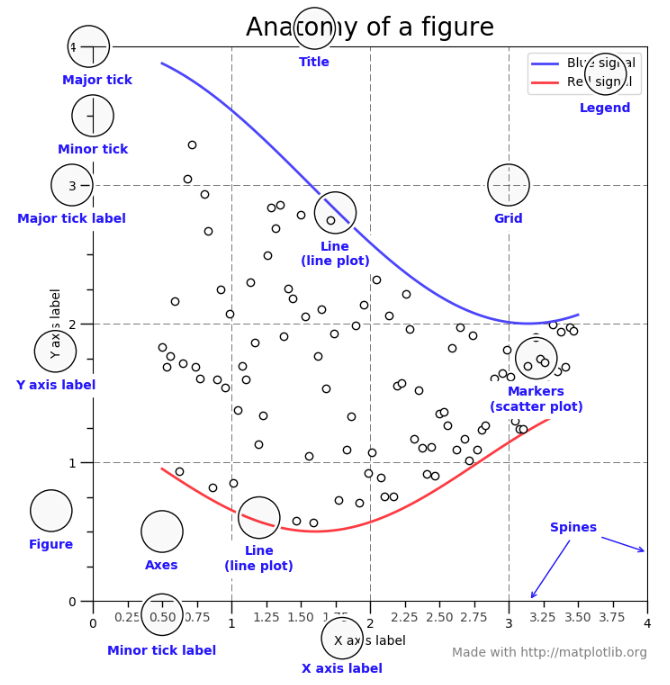
I would like to write the same sentences on above link down. It will help you to understand the basic units of OO interfaces in matplotlib.
Figure
The whole figure. The figure keeps track of all the child Axes, a smattering of ‘special’ artists (titles, figure legends, etc), and the canvas. (Don’t worry too much about the canvas, it is crucial as it is the object that actually does the drawing to get you your plot, but as the user it is more-or-less invisible to you). A figure can have any number of Axes, but to be useful should have at least one.
The easiest way to create a new figure is with pyplot:
fig = plt.figure()  # an empty figure with no axes
fig, ax_lst = plt.subplots(2, 2)  # a figure with a 2x2 grid of Axes
Axes
This is what you think of as ‘a plot’, it is the region of the image with the data space (marked as the inner blue box). A given figure can contain many Axes, but a given Axes object can only be in one Figure. The Axes contains two (or three in the case of 3D) Axis objects (be aware of the difference between Axes and Axis) which take care of the data limits (the data limits can also be controlled via set via the set_xlim() and set_ylim() Axes methods). Each Axes has a title (set via set_title()), an x-label (set via set_xlabel()), and a y-label set via set_ylabel()).
The Axes class and it’s member functions are the primary entry point to working with the OO interface.
Axis
These are the number-line-like objects (circled in green). They take care of setting the graph limits and generating the ticks (the marks on the axis) and ticklabels (strings labeling the ticks). The location of the ticks is determined by a Locator object and the ticklabel strings are formatted by a Formatter. The combination of the correct Locator and Formatter gives very fine control over the tick locations and labels.
Artist
Basically everything you can see on the figure is an artist (even the Figure, Axes, and Axis objects). This includes Text objects, Line2D objects, collection objects, Patch objects … (you get the idea). When the figure is rendered, all of the artists are drawn to the canvas. Most Artists are tied to an Axes; such an Artist cannot be shared by multiple Axes, or moved from one to another.
Alright! You have learned most basic units of OO interface. Let’s look at the pure object-oriented way of plotting.
ⅱ. Pure OO style plot
Here is some pure OO style plotting codes. I found this from matplotlib.org [Link]
It uses packages such as FigureCanvasAgg and Figure directly. But this is a bit complex way to use OO style codes. I’d rather use a simple way to handle figure and axes objects. It creates the figure object by plt.figure() and axes object by fig.add_subplot().
ⅲ. Different APIs from MATLAB style codes
You might notice the differences between two styles in the previous post. Let’s summarize the things.
- plt.xlabel() → ax.set_xlabel()
- plt.ylabel() → ax.set_ylabel()
- plt.xlim() → ax.set_xlim()
- plt.ylim() → ax.set_ylim()
- plt.title() → ax.set_title()
- plt.axis() → ax.axis()
- plt.legend() → ax.legend()
- plt.colorbar() → fig.colorbar()
- plt.clim() → handle.set_clim(), (handle = matplotlib.cm.ScalarMappable)
b. Add axes in several ways
There are three methods to create axes ( not axis ) object in OO style coding.
ⅰ. plt.subplots()
ⅱ. fig.add_subplot()
ⅲ. fig.add_axes()
ⅰ. plt.subplots()
fig.subplots returns fig and axes objects together while creating them together inside the function. fig.subplots() takes nrows (number of rows in a figure), ncols (number of columns in a figure) and num (figure label). If you want create multiple subplots by N rows and M columns, then You can write the codes like:
fig, axes = plt.subplots(nrows, ncols)ⅱ. fig.add_subplot()
While plt.subplots() create figure and axes at the same time, fig.add_subplot creates an axes object following creation of a figure object. For that, you should create figure object in advance to create an axes object such like below.
fig = plt.figure()
ax1 = fig.add_subplot(nrows, ncols, index)
You can implement the add_subplot() in two ways.
fig.add_subplot(1,1,1)fig.add_subplot(111)I prefer to use the first way, because it will be much readable when we create the multiple subplots by rows and columns such like matrix form.
ⅲ. fig.add_axes()
fig.add_axes() gives more flexibility to locate your axes (subplot). It takes rect as a parameter. The ‘rect’ describes the rectangular box that consists of 4 elements, [left, bottom, width, height].
fig.add_axes([0.1, 0.1, 0.8, 0.8])You can adjust the position of the subplot and change its width and height by taking the absolute values of the position and size elements. The fig.add_subplot() calculate the position and size relatively from the figure with index information.
I would like to give you an summarized example for more understanding.
The source code is here. [Link]
You can find additional links about adding axes.