I want to post a series of articles about object-oriented way of using matplotlib. It will explain why we should use object-oriented style and how to code like that. The main references are come from the official matplotlib website, “matplotlib.org” and the book, 『Python Data Science Handbook: Essential Tools for Working with Data, Jake VanderPlas, O’REILLY, 2017』.
Before we start, let’s see what we will deal with.
1. Why one should use object-oriented style when using matplotlib ?
a. You don’t need to be confused anymore when making multiple subplots or decorating plots between two styles
b. It’s more easy to handle the plot and create subplots
c. It can be accompany with other Python libraries, such as pandas, seaborn
d. It can be utilized to make custom plot function
e. It can help to make modularized codes
2. MATLAB style versus OO style
a. Simple Line Plots
b. Simple Scatter Plots
3. Basics of OO APIs
a. Basic objects
b. Add axes in several ways
4. Multiple Subplots
a. Multiple Subplots
b. Multiple Subplots with variable grid specs
5. Customizing Plots
a. Customizing Legend
b. Customizing Ticks
c. Customizing Colorbars
6. Artist and Useful Links
a. add_artist()
b. Useful Links
Let’s begin the first article now !!!
1. Why one should use object-oriented style when using matplotlib ?
a. You don’t need to be confused anymore when making multiple subplots or decorating plots between two styles
You may have some experience to google if you were curious about some stuffs in matplotlib. Assume that you’ve plotted a simple x^2 graph by using plt.plot() and would like to fix some stuffs.
You might want to adjust the location of the legend box, because it occluded a region of the graph. If you googled “How to adjust the location of a legend in matplotlib?”, you might find a plenty of solutions about that.
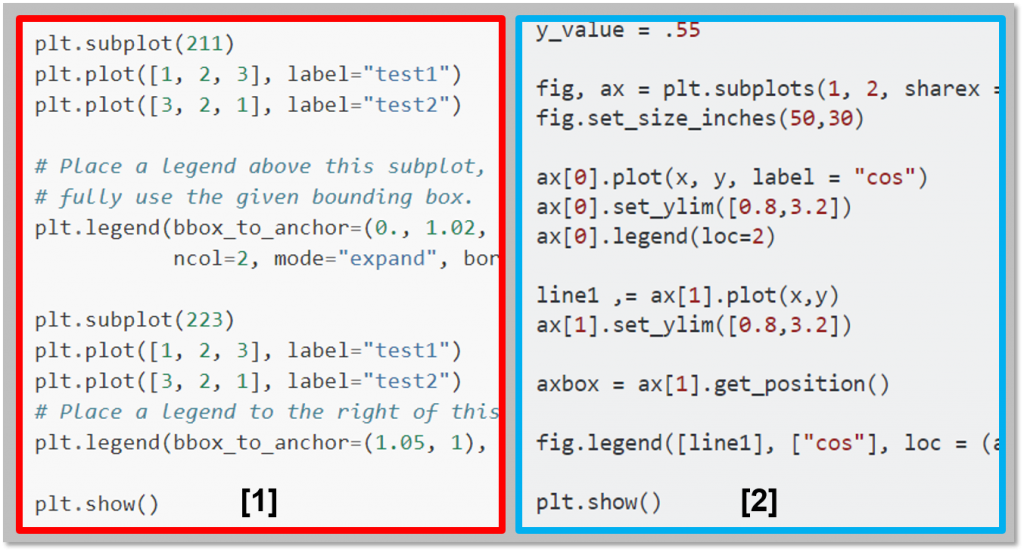
[2] https://stackoverflow.com/questions/24061296/matplotlib-adjust-legend-location-position
As you can see in the above two results, the answers have written in both MATLAB style and object-oriented style. Even, you may find some solutions that two styles are mixed-up together. Then, you can raise some questions. What is the difference between ax.plot and plt.plot? What on earth, fig.legend and plt.legend are different? If you are not familiar with both styles, you may be stuck in confusing. It makes you difficult to take some solution out directly because your matplotlib codes may also be written in MATLAB style or mixed-up style.
But if you learn object-oriented style for plotting, you don’t need to be confused anymore. That is the first reason why you should learn and use the object-oriented style of matplotlib.
b. It’s more easy to handle the plot and create multiple subplots
This reason is associated with the previous reason. If you use mixed-up style, you probably lose the way when you have to draw some complex plots.
Assume that you have drawn a very basic plot. But you want to add labels or a title of that figure after creating the very basic plot. How could you do that? If you have used MATLAB style codes, you should write the whole code again, then add the stuffs that you omitted before. That’s redundant. But if you use the OO (Object-oriented) style codes, you don’t need to write the same codes again. You just write the additional codes down in following cells. I’ve captured some sort of procedures in the following notebook codes.
On the other hand, you often make multiple subplots. The OO style codes are much easier to handle that. I will explain the way of handling multiple subplots in the forth article of this series.
c. It can be accompany with other Python libraries, such as pandas, seaborn
For exploratory data analysis, you can use pandas library so that you could easily deal with large amount data. In the most of times, you may want to draw a plot using a dataframe of pandas. You may want to draw a relationship of between two variables, an aggregation result by groups, a trend in time-series or a correlation among parameters. The pandas gives you a plot function and you can handle the plot by using axes. That’s the object-oriented way of using it. Let’s follow below example.
d. It can be utilized to make custom plot function
One of the main advantages of using OO style codes is that it can utilize the plotting functions and object concepts well. If you organize the plotting codes with axes and its parameters well, it will give you more productivity when creating plots. An OO style code for drawing a histogram is provided in below example. It is drawn with OO APIs followed by implementing with a plotting function which takes ax(es) and its params as an input. Whenever you want to draw some histograms, you can just use that plot histogram function. That increases re-usability of codes.
e. It can help to make modularized codes
In a similar manner to above section, we can create sub modules by using OO style codes. It’s convenient to handle axes object to draw part of figure which is usually considered as subplots. Otherwise, you can create different plot functionality by different drawing objects.
In the next post, I will show some examples of MATLAB style codes versue OO style codes. You may find the differences between OO style codes and MATLAB style codes.