In the previous post, I emphasize to learn and use Object-orient style of matplotlib. In this post, I want to give you a fast glance to catch the differences between MATLAB style and OO style. It will help you to grasp the concept of object-oriented style well.
The main references are come from the official matplotlib website, “matplotlib.org” and the book, 『Python Data Science Handbook: Essential Tools for Working with Data, Jake VanderPlas, O’REILLY, 2017』.
2. MATLAB style versus OO style
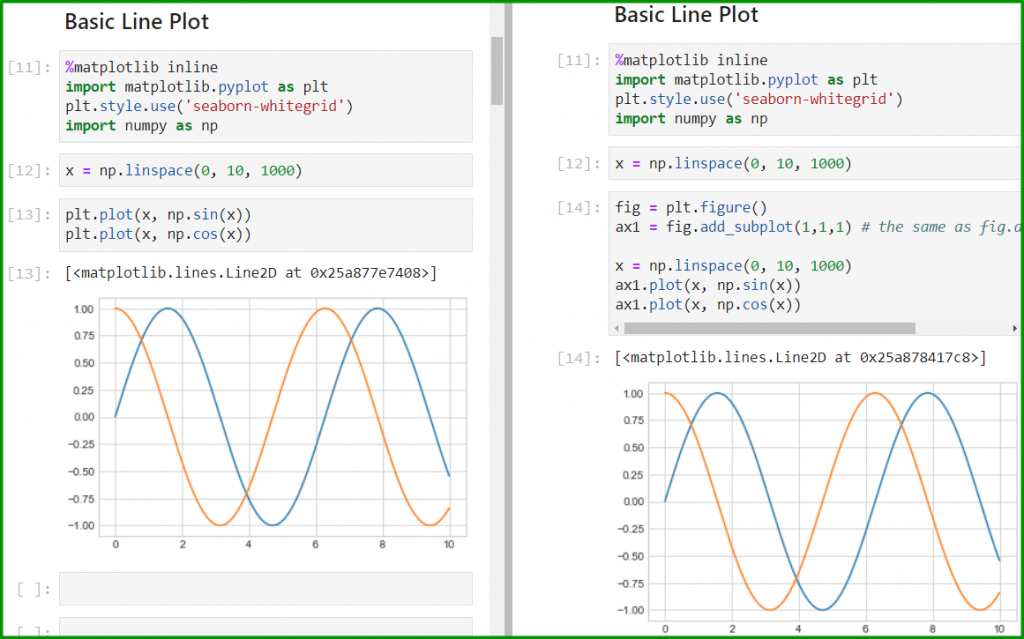
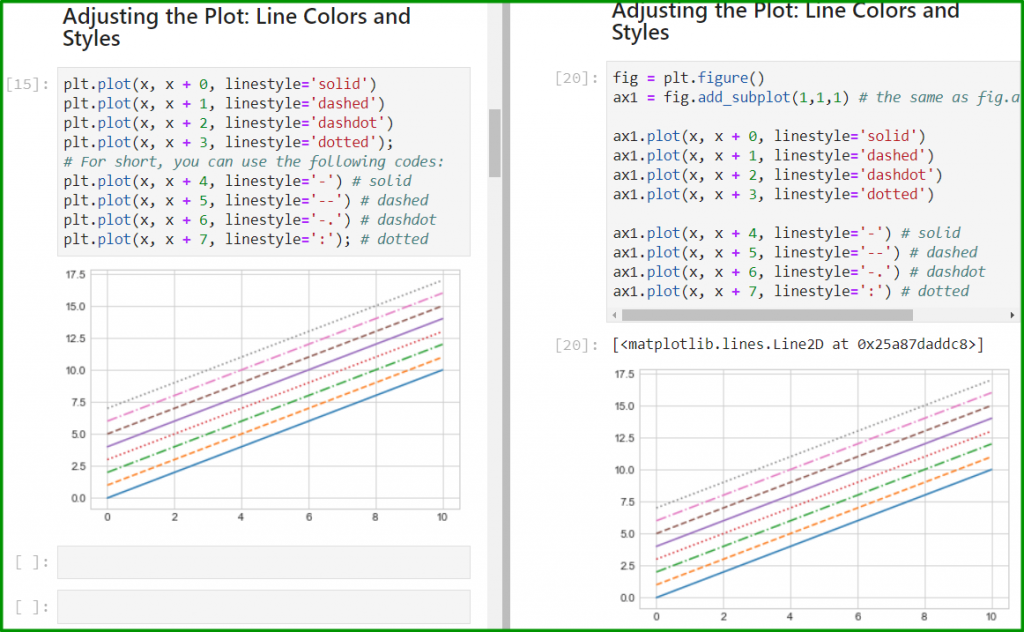
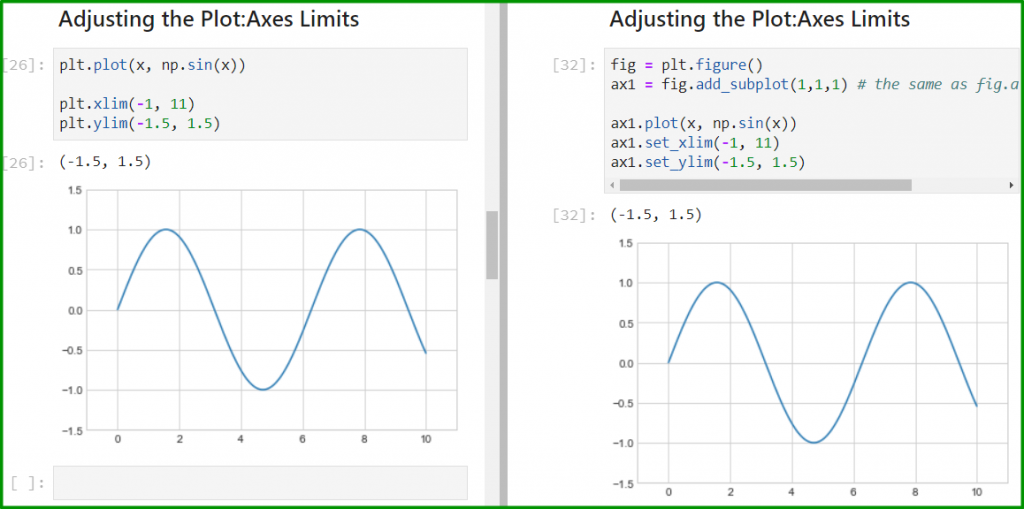
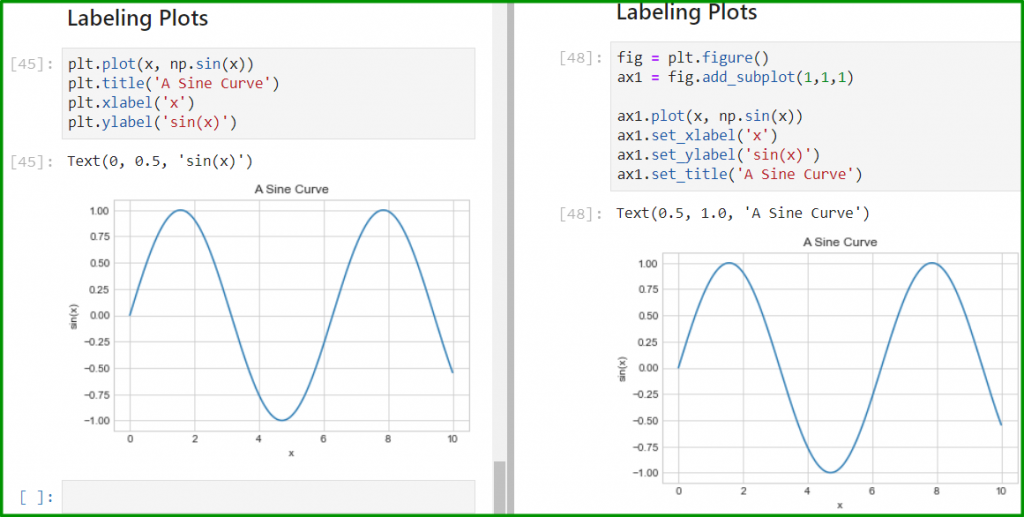
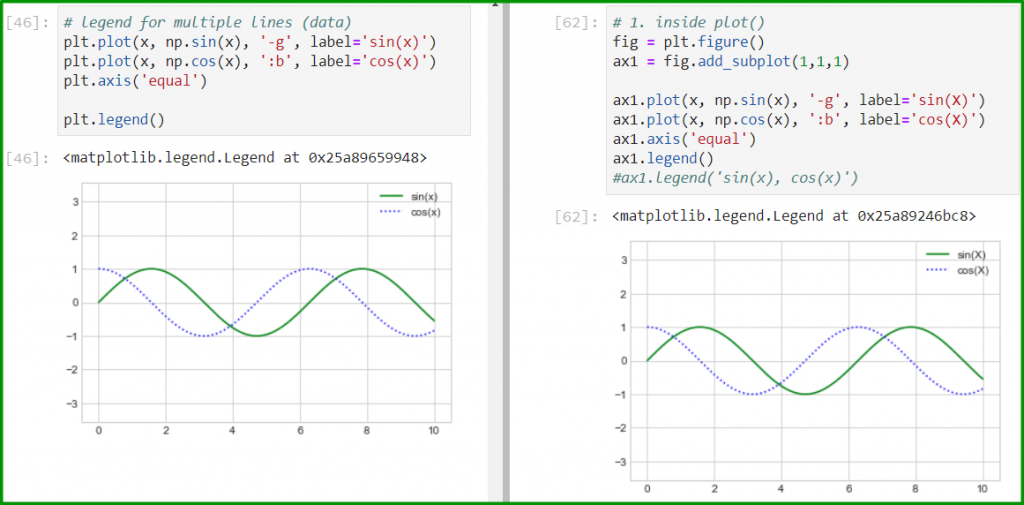
a. Simple Line Plots
The most of contents in this post borrowed from the book, 『Python Data Science Handbook: Essential Tools for Working with Data, Jake VanderPlas, O’REILLY, 2017』. For the comparisons I added somewhat codes for getting equivalent result for each examples. At the end of this post, there is a link to full github codes of this post. So, you just look below figures written in two different styles.
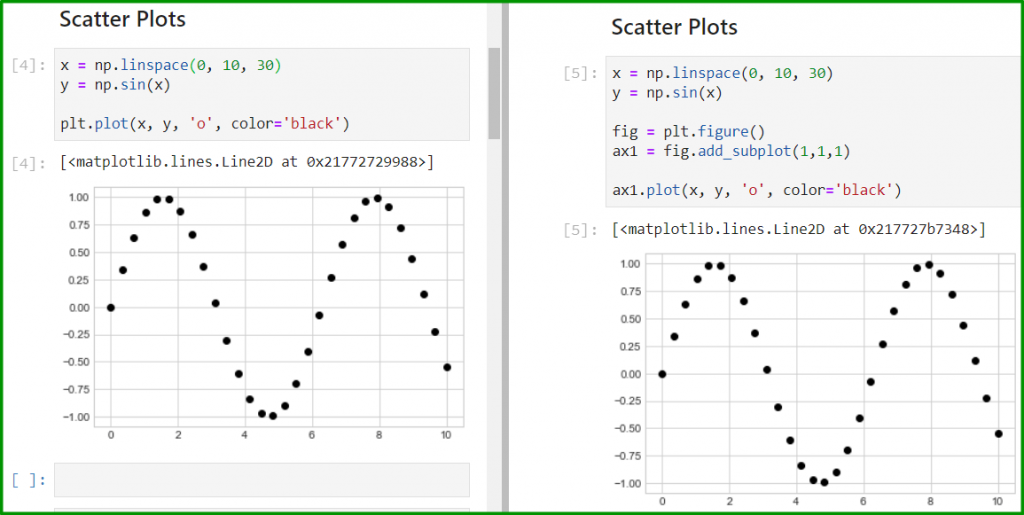
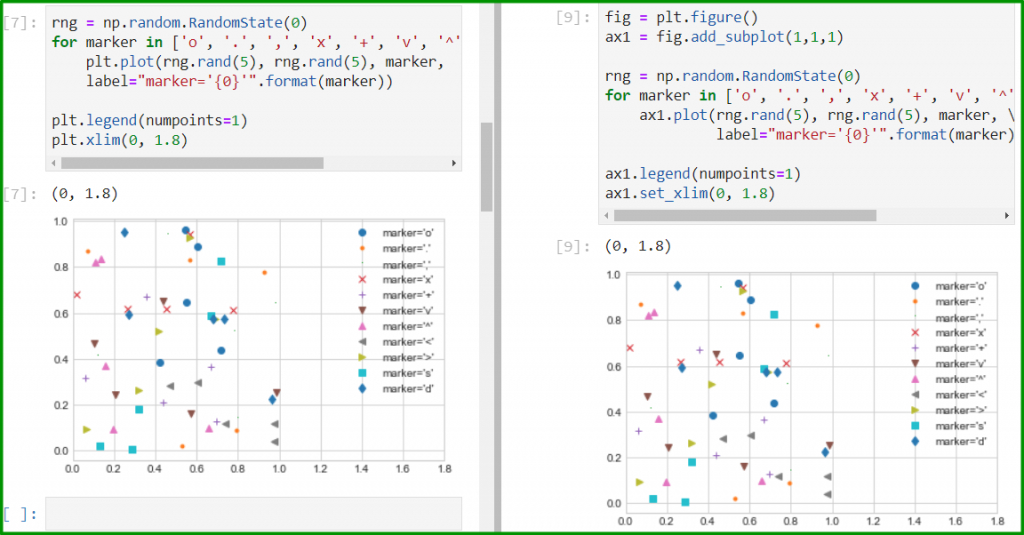
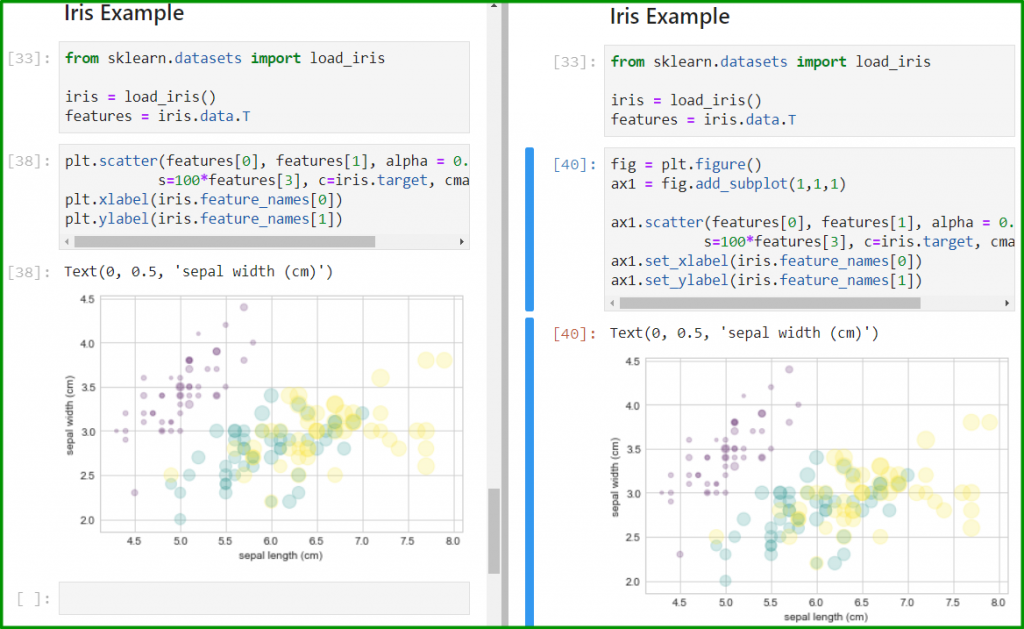
b. Simple Scatter Plots
Here are another examples of most popular plot, scatter plot. You can find the differences between two styles. There are slight more differences that you could notice than those in simple line plots.
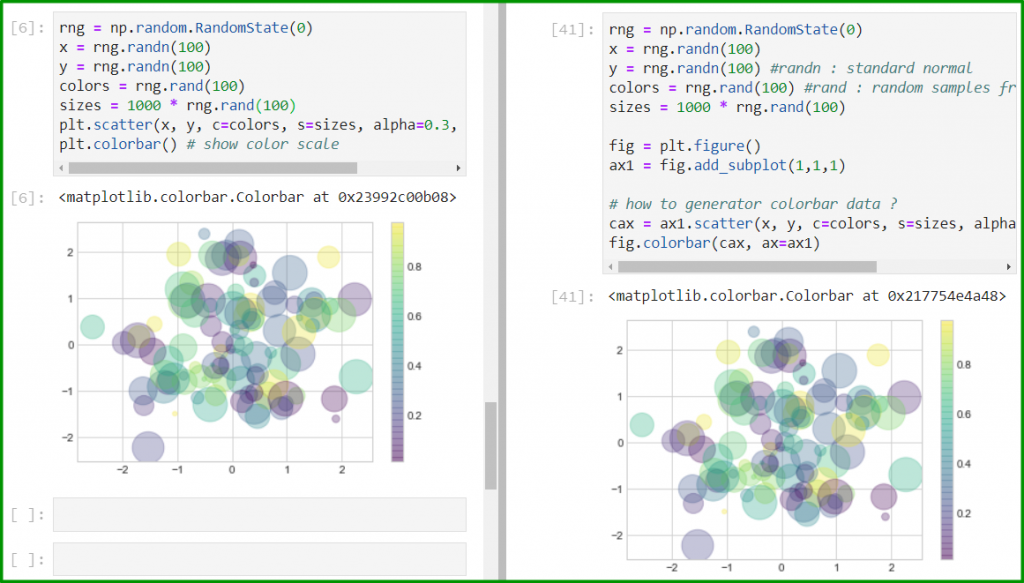
The full sources are below.