likelihood ?
우도라고 말하면 당최 무슨 말인지 감이 잡히지 않는, 잡힐 듯 잡히지 않는 개념이었다.
나는 오히려 가능도라고 부르는 것이 더 나아 보인다. 가능도의 개념을 잡기 위해서 참고한 부분을 먼저 소개한다.
우선, sw4r 님의 블로그에 방대한 내용의 수리통계학 관련 포스트를 참고했다. 또, 위키피디아의 ‘Likelihood function‘에 관한 정의를 참고했다. 여기 나온 정의 부분과 내용 전개 부분에서 많은 도움을 얻었다. 또, plasticcode 님의 블로그에서 우도의 실제적인 예를 확인 할 수 있었다.
정의 부분을 살펴보자. 이 부분은 어쩔 수 없이 sw4r 님이 언급한 위키피디아의 정의 부분을 같이 실을 수 밖에 없을듯 하다.
In frequentist inference, a likelihood function (often simply the likelihood) is a function of the parameters of a statistical model, given specific observed data. Likelihood functions play a key role in frequentist inference, especially methods of estimating a parameter from a set of statistics. In informal contexts, “likelihood” is often used as a synonym for “probability“. In mathematical statistics, the two terms have different meanings. Probability in this mathematical context describes the plausibility of a random outcome, given a model parameter value, without reference to any observed data. Likelihood describes the plausibility of a model parameter value, given specific observed data.
즉 가능도는 확률의 다른 말처럼 종종 쓰이는데, 수학적으로는 다른 의미를 지니고 있다.
확률이 모델 파라미터값이 관측 데이터 없이 주어진 상태에서 랜덤한 출력이 일어날 가능성이라면, 가능도(likelihood) 는 특정 관측 결과가 주어진 상태에서 모델 파라미터 값들이 나타날 가능성이다.
확률과 가능도는 반대되는 개념이 된다. 확률이 모 파라미터를 알고 랜덤 변수 X 를 미지수로 표현되는 식이라면 가능도는 관측치 X 가 주어진 상황에서 파라미터 \theta 를 변수로하는 식으로 표현된다.
확률 밀도 함수가 랜덤 변수 X 와 주어진 파라미터 \theta 로 이뤄졌다고 하면,
f(X|\theta) 로 표현된다.
이에 반해 가능도는 X 가 주어지고 \theta 에 대한 확률을 표시하는 형태가 된다.
L(\theta|X)
일반적으로 표본으로부터 n 개의 관측결과가 있다고 하면 likelihood 는
L(\theta|x_1,x_2,\cdots,x_n) 와 같이 표현할 수 있다.
대개 관측값들은 서로 독립적이고 Random 하게 추출되었다고 가정하기 때문에 다음과 같이 곱으로 표현할 수 있다.
L(\theta|x_1,x_2,\cdots,x_n)=L(\theta|x_1) \times L(\theta|x_2) \times \cdots \times L(\theta|x_n)
가능도를 좀 더 쉽게 이해하기 위해 plasticcode 님의 예제 를 살펴보자.
Q : 5개의 Sample(표본) = (-1, -0.5, 0, +0.5, +1) 이 정규분포를 따른다고 가정할 때, 이 때 이 정규분포의 평균과 분산은?
A : 모 파라미터 \mu 와 \sigma 값을 구하기 위해 몇 가지 likelihood 값을 구해서 비교해 볼 수 있다. 가장 큰 likelihood 값을 갖는 경우에 5개의 표본을 가장 잘 설명하는 모 파라미터라고 할 수 있다.
R Code 를 짜서 확인해 보았다. 자세한 R Code 는 Github 를 참조하기 바란다.
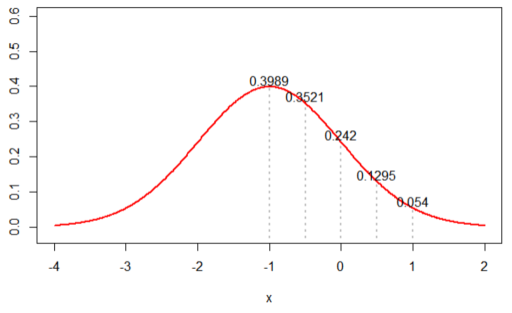
1. N(-1, 1)을 가정한 경우, likelihood 값은 ‘0.0002376545’ 가 나왔다.
(아래 그래프 상의 5개 값을 곱한 값)
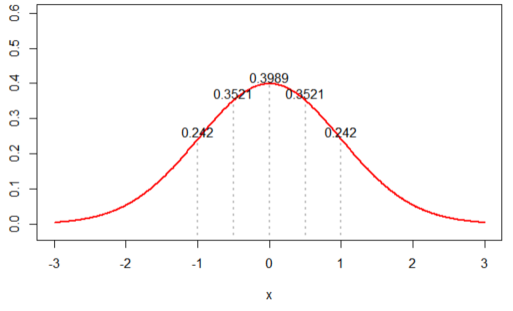
2. N(0, 1)을 가정한 경우, likelihood 값은 ‘0.002895224’ 가 나왔다.
4. N(3, 1)을 가정한 경우, likelihood 값은 ‘4.898424e-13’ 가 나왔다.
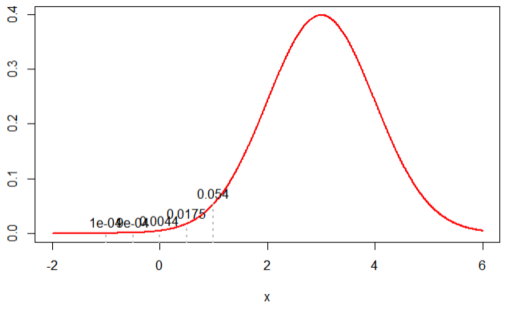
즉, 3 가지 테스트한 경우 N(0, 1) 을 가정한 경우 가장 likelihood 값이 높았다. 제한적인 샘플의 결과만 놓고 판단했을 때 N(0,1) 의 정규분포를 가정하는 것이 타당하다고 할 수 있다. likelihood 는 이렇듯 표본의 관측값에 따라 다르게 추정할 수 있다.
probability vs likelihood 라는 제목으로 아주 쉽게 설명한 동영상이 있어서 소개한다.
이 분의 동영상을 종종 사용하게 될거 같다.